Exploring The History & Origin of Candlestick Patterns
Estimated reading time: 6 minutes
Key Takeaways
- Candlestick patterns have a rich history originating in Japan.
- The impact of Munehisa Homma is pivotal in the development of these techniques.
- Understanding timeframes is crucial for effective trading.
- Several misinterpretations can lead to trading errors.
- Knowledge of terminology enhances trading proficiency.
Table of contents
Candlestick charting emerged from Japan as a method for tracking rice prices about three centuries ago. Japanese traders initially employed this handy tool, which has since undergone modernization and global adoption over time, especially in the forex market [source]. The success of candlestick patterns in forex trading predominantly stems from their ability to compress sophisticated market information into visually understandable cues.
1. Homma’s Early Candlestick Techniques: Munehisa Homma, a prosperous Japanese rice trader, initiated the primary application of candlesticks. Homma arguably was the pioneer of price action trading, realizing that the market sentiment heavily influenced the rice prices, rather than the supply and demand factors.
2. Further Evolution & Global Expansion: Steve Nison was instrumental in introducing candlestick charting to the West in the 1990s. His book, “Japanese Candlestick Charting Techniques,” has since been recognized as a pivotal resource in technical analysis.
Despite the many technological advances in market analysis, the fundamental principles of candlestick charting remain highly relevant in today’s trading world. Delve deeper into the historical background and development of candlestick charts at Forex Academy.
Role of Timeframes in Candlestick Patterns
The power of candlestick patterns lies in their versatility across different timeframes, enabling traders to analyze various periods depending on their trading objectives. Each candlestick represents a specific duration, such as an hour, day, week, or month. The timeframe choice is usually determined by the trader’s style:
1. Scalping: Short-term traders who hold positions for a few minutes to an hour often utilize one-minute to a 15-minute chart.
2. Day Trading: Traders who enter and exit positions within a single day usually prefer 1-hour to 4-hour charts [source].
3. Swing Trading: These traders, aiming for larger price movements over several days or weeks, often find daily charts more useful.
4. Long-term Trading: For those targeting more substantial trend developments over months or years, weekly or monthly charts become crucial [source].
Exploring Common Misinterpretations of Candlestick Patterns
While candlestick patterns are widely used and powerful, they can be misunderstood, leading to potentially harmful trading decisions. Here are some common misinterpretations to avoid:
1. Ignoring the Market Context: Candlestick patterns should not be analyzed in isolation; instead, they should be evaluated against broader market trends and levels [source].
2. Faulty Confirmation Bias: Traders tend to gravitate towards higher-value patterns supporting their preconceived market notions, leading to a biased investment approach.
3. Misunderstanding Pattern Requirements: Failing to verify a pattern’s conditions before acting on it can lead to erroneous conclusions.
4. Overdependence on Candlestick Patterns: Though useful, these patterns should be one part of a more comprehensive trading strategy, not the sole basis for decision-making [source].
Common Trading Mistakes To Avoid When Using Candlestick Patterns
As crucial as candlestick patterns can be to a successful trading strategy, common pitfalls can detract from their effectiveness if not steered clear from:
1. Relying Solely on Patterns: It’s easy to fall into the trap of relying solely on candlestick patterns for trading decisions. Remember, patterns only make up part of a well-rounded strategy [source].
2. Ignoring the Market State: Always consider the broader market trends and levels while interpreting candlestick patterns [source].
3. Lack of Patience: Missing or misreading patterns because of impatience is easily avoidable with practice and caution.
4. Overtrading: Generating consistent profits requires patience; overtrading usually results in more losses than gains.
5. Ignoring Risk Management: A robust risk management strategy can protect your trading capital, making it an essential part of successful trading alongside pattern recognition.
Try to avoid these mistakes for more effective trading. Revisit this article on Forex Academy for refreshing your understanding.
Learning The Language of Candlestick Patterns
As with any field, understanding the specific language and terms applied can significantly help your understanding and proficiency in pattern recognition and analysis [source].
1. Gap: A separation in the price chart where the asset did not trade.
2. Pullback: A temporary interruption of a trend that allows price to move against the trend before it continues in the original direction.
3. Breakout: When price passes through and stays beyond an area of support or resistance.
4. Consolidation: A period of indecisiveness where the price moves within a narrow range, and the market is waiting for information to direct the price.
By learning and understanding the terminology associated with candlestick patterns, you can better interact with and access expert resources, forums, and learning platforms online. You can find a comprehensive list of related terms at Forex Academy.
Frequently Asked Questions
1. What are candlestick patterns?
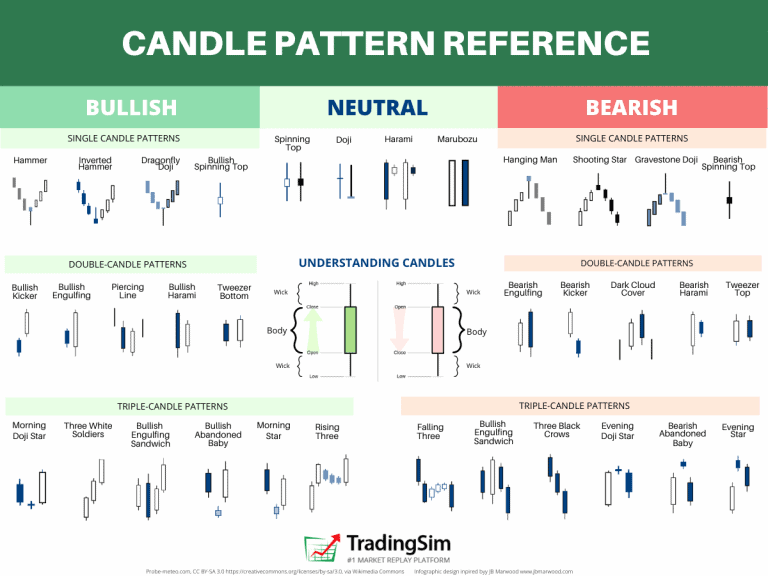
Candlestick patterns are graphical representations of price movements in a specific time frame, used by traders to predict future price movements.
2. Why are candlestick patterns important for trading?
They provide insights into market sentiment and potential price reversals, which can be crucial for making informed trading decisions.
3. Can candlestick patterns be used in any market?
Yes, they can be used in various financial markets, including stocks, forex, and commodities.
4. How can I learn more about candlestick patterns?
You can find resources online, including articles, videos, and courses dedicated to candlestick charting and technical analysis.

